Executive Level Reporting

My Brand Performance dashboards provide valuable data and insights that help you track the performance of your brand and make informed decisions. These dashboards include data on key metrics such as sales, pricing, and distribution. By monitoring these metrics, you can stay on top of how your brand is performing and make data-driven decisions to improve your brand’s success. The reports are available in the basic package and above.

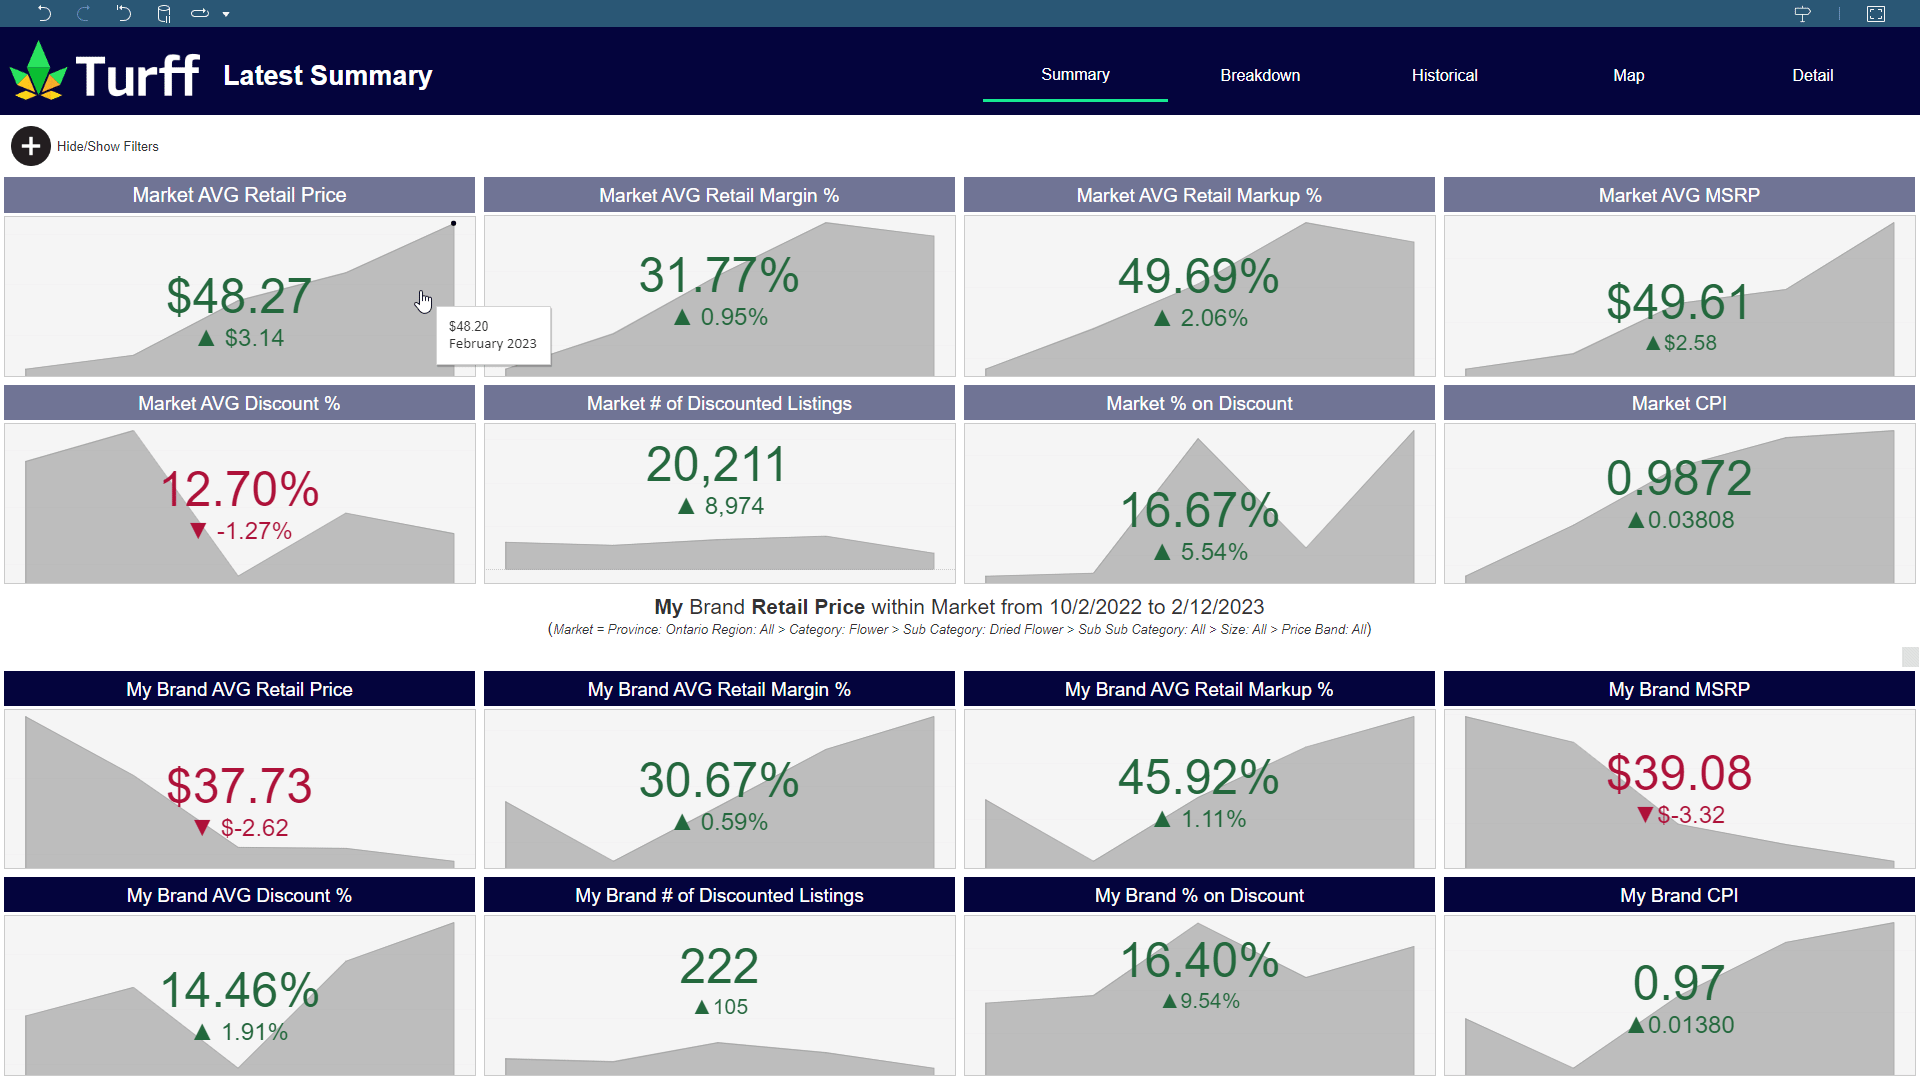
  1. Are our products priced competitively in the market?

  2. Are our competitors offering more discounts than we are?

  3. Is our brand's markup higher or lower than the market average?

  4. Are there specific regions where our products are underpriced or overpriced?

  5. How has our pricing strategy evolved over time and what can we learn from it?

  6. Are we missing out on potential sales by not offering enough promotions?

  7. How do our prices compare with those of other brands in our category?

  8. How much of a premium are consumers willing to pay for our brand compared to the market average?

  9. Which areas are driving the most sales and at what price points?

  10. Are there any outliers in the data that may indicate a pricing error or opportunity?

Summary


The Summary section provides a high-level overview of the key metrics and trends for your brand and products in the market. This section typically includes a set of visualizations that highlight the most important KPIs and trends, giving you a quick snapshot of your brand’s performance.